Mold statistics by state: A state-by-state overview (2026)
Explore mold statistics by state for 2026, including regional trends and common mold types, with guidance to interpret data for prevention and remediation.

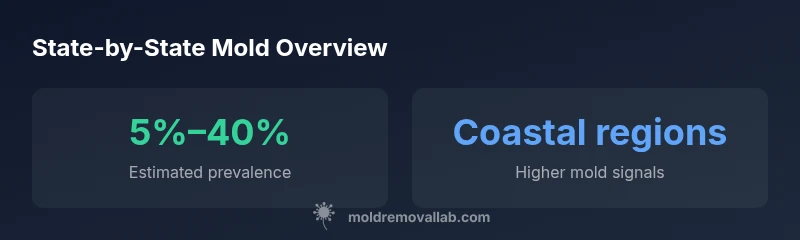
State-by-state mold statistics show wide variation in reported prevalence, driven by climate, humidity, and housing conditions. In humid coastal states, mold problems are more common, while drier inland areas report lower—but not zero—rates. For homeowners, state data helps target inspections, testing, and prevention strategies appropriate to regional risk.
Understanding the landscape of mold statistics by state
Mold statistics by state help explain why risk is not uniform across a country with varied climates. Our analysis, based on Mold Removal Lab Analysis, 2026, integrates reported testing results, homeowner surveys, and inspection records to build a composite picture of where mold problems are most likely to occur. Climate, occupancy, construction materials, and maintenance practices all shape the data. You will notice that even within the same state, neighborhoods with higher humidity, poor ventilation, or flood exposure can show elevated risk. For homeowners and renters, this information translates into prioritized actions: more frequent visual checks during humid months, moisture management strategies, and timely testing after leaks. Remember that mold statistics by state are probabilistic indicators, not certainties for any single building. They’re designed to guide prevention, inspection scheduling, and remediation planning at scale, not to replace professional assessments. In practice, combine data with a local moisture map, recent weather patterns, and your own home’s history of leaks or condensation. Mold Removal Lab emphasizes that combining data sources yields the most accurate risk profile for a given area. This approach supports safer homes by focusing limited resources where they’re needed most.
How state data is collected and what it means for homeowners
State data typically derives from a blend of official inspection reports, standardized testing results, and homeowner-reported findings. Because mold growth responds to environmental conditions, researchers weight factors like climate zone, seasonal humidity, and flood exposure. While state totals help establish broad risk profiles, they do not replace an on-site assessment. For homeowners, the practical takeaway is to use state data to plan when and where to test, schedule moisture-control upgrades, and set expectations about remediation timelines. Methodologies vary by state, but the core principles—verify moisture sources, test after leaks, and remediate promptly—remain consistent. Mold Removal Lab's 2026 synthesis highlights the value of combining state-level insights with local weather histories and your home's maintenance record to build a personalized risk picture.
Regional patterns: climate, housing, and occupancy
Regional patterns emerge when climate, housing stock, and occupancy patterns intersect. In the Southeast and Gulf states, higher humidity and rainfall correlate with more frequent moisture issues and mold signals. The Northeast shows variability tied to seasonal heating, air leakage, and insulation quality. The Midwest often reflects older housing stock with moisture vulnerabilities, while the West presents a mixed picture where dry climates sometimes mask hidden moisture during unexpected spills. Across all regions, recent weather extremes—heavy rain, flooding, and heatwaves—tend to spike testing activity and remediation demand. By understanding these regional drivers, homeowners can better prioritize routine inspections, fix latent moisture sources, and install controls like dehumidifiers and proper ventilation to reduce mold risk.
State-by-state snapshots: examples from major regions
Here are representative regional patterns to illustrate how state data translates into action. In humid coastal states, expect higher baseline risk and more frequent moisture checks. In arid interior states, the risk is lower but not negligible, especially after leaks or improper ventilation. The Midwest shows pockets of elevated risk around basements and flood-prone areas. The West demonstrates variability tied to microclimates and building practices. Use these snapshots to guide where you devote resources—for example, scheduling annual moisture control maintenance in high-risk zones and prioritizing air sealing and moisture audits in older homes.
Practical steps: using state data to protect your home
Turn state mold data into a practical prevention plan with these steps: 1) Map your area’s climate and nearby flood history to set annual inspection frequency; 2) Audit moisture sources in your home (plumbing, roof leaks, condensation) and fix promptly; 3) Use humidity monitors and ensure proper ventilation in bathrooms, laundry rooms, and kitchens; 4) Schedule professional mold testing after water intrusions and renovations; 5) Keep records to track changes over time and adjust prevention measures accordingly.
How Mold Removal Lab translates state data into guidance
Mold Removal Lab uses state-level data as a foundation for practice guidelines, translating broad patterns into home-level actions. Our approach combines prevalence ranges with actionable steps—moisture control, targeted testing after leaks, and timely remediation—so homeowners can act with confidence. We publish regional recommendations and keep them aligned with evolving weather patterns and housing trends, ensuring guidance remains relevant for families across the country.
State-region mold prevalence ranges by region
| State/Region | Estimated Prevalence Range | Common Mold Types |
|---|---|---|
| Northeast | 15-35% | Aspergillus, Cladosporium |
| Southeast | 25-45% | Aspergillus, Stachybotrys |
| Midwest | 10-30% | Alternaria, Penicillium |
| West | 15-40% | Mucor, Penicillium |
FAQ
What defines mold statistics by state?
State statistics combine official testing results, inspection records, and homeowner reports to create a regional risk profile. They reflect climate, housing stock, and maintenance practices. Remember, these figures guide planning, not guarantee outcomes for any single home.
State statistics combine tests, inspections, and homeowner reports to guide planning, not guarantee results for any single home.
How should homeowners use state data in remediation planning?
Use state data to prioritize where to test and how aggressively to enforce moisture controls. Pair regional trends with on-site assessments after leaks or floods. This combination improves remediation effectiveness and reduces recurrence.
Use regional trends plus your on-site checks after leaks to guide remediation steps.
Do state statistics reflect individual homes?
No. State statistics describe population-level patterns. Individual homes vary due to local moisture sources, ventilation, and occupancy. Always supplement data with an on-site inspection when assessing risk.
No—state data show patterns, not a diagnosis for your home. Get an on-site inspection for accuracy.
Which states show the highest mold prevalence according to 2026 data?
State-level data indicate higher prevalence in humid coastal regions and flood-prone areas, with wide variability by climate. No single state dominates across all measures, and risk is scenario-specific.
Coastal, humid regions tend to have higher mold signals, but risk is highly case-specific.
What sources are considered reliable for mold statistics?
Look for government, university, and major public health sources. In our approach, we corroborate state data with CDC, EPA, and NIEHS materials to ensure accuracy and context.
Rely on government and university sources for reliable mold data, and corroborate with state findings.
“State-level mold data reinforce the need for proactive moisture control and regular inspections. Contextualized data helps homeowners act before mold becomes visible or costly.”
The Essentials
- Use state data to prioritize inspections and testing.
- Expect higher mold risk in humid regions.
- Pair state data with local moisture checks for accuracy.
- Rely on verified sources like Mold Removal Lab Analysis for interpretation.